Posts

Showing posts from 2009

Santa's got a huge sleigh this year...

Image
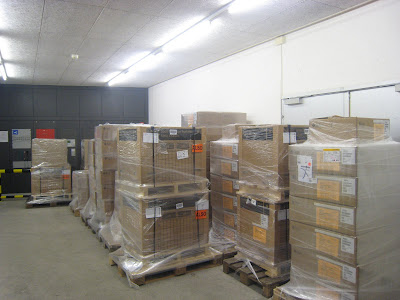
Delivery on the 24.12.2009 18 Pallets 365 Boxes (One for every day I was a good boy) 2.7 Tons

Efficient metadata caching

Image
In my last post I was talking about 1 Million mailboxes. Each of them is a directory with several subdirectories, like Trash, Sent Items etc. The mailbox directory itself lies 4 directories below the root node (like /a/b/c/mailbox). The hierarchy is managed by our mail-store application. I don't know the average number of files/directory, but let's assume, each mailbox consists in average of 20 files/directories, we would currently have about 20'000'000 inodes. Mailbox access is mostly random. We don't know when a mail is coming in, we also don't know about when a user is reading his mails. What we now from experience is, that a lot of time is spend in looking up metadata. With mostly random access (we measured it as ~ 55% write / 45% read a while ago), and the amount of data, the chance to identify a data working set is quite low. Ok, maybe recently received emails could be part of a "working-set". But wouldn't it be great if we could cache as muc...
The noise of 1'000'000 inactive mailboxes

Image
We have now migrated all inactive mailboxes (some may obviously be active again) to one 7410 Cluster. What you can see is the IO generated by these boxes. Even if the mailboxes are abandoned they receive mails (spam, newsletters etc.) Storage2/HDD4 and storage2/HDD8 are again the mirrored SLOG devices. As we can see here, they don't have any problems at all with the write load. If you look at all the other HDDs you see the low IOPS numbers Looking at how many bytes per seconds are going through the disks we can see that the SLOGs are busy collecting all synchronous bits and bytes. The slow 1TB disks get about ~700k of data per second. Looking at e.g. HDD11 we see a low number of IOPS. I would guess the average IO size is about 60-70kB. As a reference, an email is around 4k to 8k. What this means: We get larger IOs to the disk thanks to the slog. Thanks, mighty Logzilla :-)

SLOG Latency

Image
After reading Brendan's newest blog entry, I was curious about what kind of slog latency we can see for our data migration load. To remind you, only synchronous writes go into the slog SSD devices. As this is a migration running, we can see mostly NFS write operations: In our configuration the SSD slog is mirrored (HDD4 and HDD8). Hence the same number of IOPS: The next picture shows us the latency for our SDD SLOG Device HDD 4. We can see here that latencies start at 79 us and are mostly under 200 us. There are some outliers, but approx. 95% are under 500 us: This matches quite well with the values Brendan blogged about (137-181 us), which includes NFSv3 latency. For reference (no picture here), we can see latencies of about 170-500 us mostly for NFSv4. By the way. SLOG Devices are mostly one way devices, as shown here. Only if things go really bad, they are read from...

Resilvering progress...found!

Found the CLI menu for resilvering progress :-) file1:configuration storage (pool-1)> show Pools: POOL OWNER DATA PROFILE LOG PROFILE STATUS pool = pool-1 file1 mirror_nspf log_mirror_nspf degraded Properties: pool = pool-1 status = degraded owner = file1 profile = mirror_nspf log_profile = log_mirror cache_profile = cache_stripe scrub = resilver in progress for 4h46m, 83.85% done, 0h55m to go

High IOPS for 1TB Disks

Image
Wondering how 1TB disk can have such a high IOPS. HDD8 and HDD4 are Log-Devices (SSD) UPDATE: For the moment I assume, these are writes to the disk cache.

Being bored....

Image
...while doing 22536 NFS ops per second, and doing gzip-2 at the same time. HSP really works. NFS synchronous operations get "eaten" by the SSD devices (1133 IOPS).

Trekkie Stuff...

Image
Enterprise Warp Core: Borg Cube: PS: We all know who won in the end ;-)