Posts

Showing posts from 2010

Just in time delivery...

Image
...before the end of year. In the picture below: 4x S7420 1TB RAM 4TB ReadZilla 16x LogZillas 352x 1TB SAS-2 Disks 16 JBODs

53734 NFSv4 ops/sec

Image
Not bad. Still more than enough headroom left...

Adventures in Application Performance Management: Part II

Image
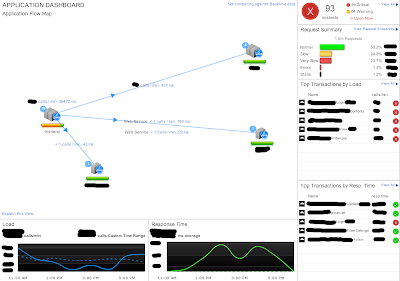
Firing up AppDynamics inside the browser shows a list of application agents, and also external systems being called by our application. The nice thing is, AppDynamic automatically detects calls to external systems, like WebServices etc. Grouping the agent and surrounding systems a little bit, AppDynamics presents us a nice dashboard, with the most important information. The large area shows the calls to other systems. On the bottom we see the load (calls/minute) and average response time: As you can see, the number of calls goes down, while the response time goes up at the same time. A clear case of a bottleneck... To find the reason for this, we look at the right side of the dashboard. AppDynamics automatically classifies requests into categories (can be adjusted).  We can clearly see that we have 1.2% Stalls, for this timeperiod. We can further see which were the top transactions by load and by response time. 

Adventures in Application Performance Management: Part I

Who follows my blog, knows that I'm a Splunk addict, because I really like to know what my applications and systems are doing. Although Splunk is my favorite tool in my toolbox (and will be in the future... :-), there are some blind spots it can't see. We have struggled with some serious performance problems in one of our core applications during peak-hours. The application is Java-based, and usually performs well, when everything is ok. But during peak-hours, the response time gets worse and worse, having the side-effect of long major garbage collections. Not very user friendly, when there is a long stop-the-world. We were looking at the problem from the top (log analysis, monitoring) to the bottom (gc logs, jprofiler) never really finding the root cause of the problem. The fact that the problem did not occur all the time did not make it easier... As the situation got worse over time, and adding even more hardware was not really a solution, we were looking for some e

Countdown to ONE BILLION FILES!

I was reading Ric Wheelers "One Billion Files: Scalability Limits in Linux Filesystems" . As a ZFS user, I was wondering how many files we store on one of our mail storage systems in a single zpool. My colleague was so kind to start a find on the system. Four days later we got # find /export -type f | wc -l   811874848 Interesting. We are already close to one billion files in production . Next step was to look at the average file size. Currently, 12.5TB are referenced, compression ratio is 1.77x. This results in a average size of ~30kB. How long will it take to reach one billion files?  In average, 60 mails get delivered per second to the storage system (over NFSv4!). Therefore, to get the missing 190 million files, we only need to wait a little bit more than a month.

DTrace saving the planet again....

Image
...maybe not the planet, but DTrace was again a big help in finding another performance problem. During peak-hours and when we had a spam-wave coming in, we saw a spike on our T5120 systems. Where we usually see a very low load of ~ 1-2, the load jumped up to 400 within a few minutes. Something did'nt seem right. Like with the previous DTrace Problem, we saw that our userland processes had a high system time, so most of the things it was doing (or maybe not) was in the kernel. It was time to use one of the secret weapons that Solars Admins have: lockstat (uses DTrace). Sorry for the lengthy output... # lockstat -i 133 -I sleep 5 Profiling interrupt: 43328 events in 5.088 seconds (8516 events/sec) Count indv cuml rcnt     nsec CPU+PIL                Caller                  -------------------------------------------------------------------------------   155   0%   0% 0.00     2347 cpu[42]                rdccr_delay+0x8           152   0%   1% 0.00     2184 cpu[53