Adventures in Application Performance Management: Part II
Firing up AppDynamics inside the browser shows a list of application agents, and also external systems being called by our application.
The nice thing is, AppDynamic automatically detects calls to external systems, like WebServices etc.
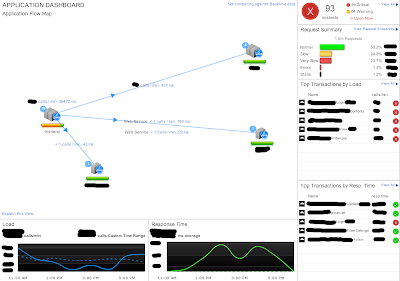
Grouping the agent and surrounding systems a little bit, AppDynamics presents us a nice dashboard, with the most important information.
The large area shows the calls to other systems.
On the bottom we see the load (calls/minute) and average response time:
As you can see, the number of calls goes down, while the response time goes up at the same time. A clear case of a bottleneck...
To find the reason for this, we look at the right side of the dashboard.
AppDynamics automatically classifies requests into categories (can be adjusted). We can clearly see that we have 1.2% Stalls, for this timeperiod.
We can further see which were the top transactions by load and by response time.
Transactions are autodetected by AppDynamics and will be monitored automatically.
You can look at suspicious transactions, or look at stalled requests. AppDynamics automatically takes request snapshots including call graphs.
Back to our performance problem...
After finally seeing how the application works internally, we found the reason for our performance problem within hours. We had a method that was synchronised. During the peak-hours, requests (many!) had to wait. This caused not only a huge slow-down, but also lots of objects that had to be collected by the garbage collector, and caused long application pauses
After fixing this single method, our application has been faster than ever...


Comments
best Regards, sz@sysperform.ch