DTrace to the rescue!
We recently migrated data to some older servers and ran into a performance problem during peakhours.
Analysis
On our busiest days, we've seen the load go up to over 300. Luckily this is a SPARC system, and it was still somewhat responsive. Not bad for an old 2 Socket system...
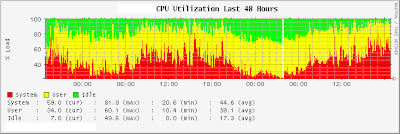
Looking at the CPU utilization using vmstat, showed a high percentage of time spent in SYS.
You can see this in the two performance graphs (the graphs were made on a Sunday, with a lower load).

After looking at the processes with prstat -Lm (microstate accounting) and seeing the high SYS-percentage, we decided to look at what the kernel is doing.
Solaris has a nifty tool called lockstat. This is what it revealed:
# lockstat -i 133 -I sleep 5
Profiling interrupt: 1394 events in 5.241 seconds (266 events/sec)
Count indv cuml rcnt nsec CPU+PIL Caller
-------------------------------------------------------------------------------
214 15% 15% 0.00 1982 cpu0 (usermode)
174 12% 28% 0.00 3809 cpu[0] (usermode)
105 8% 35% 0.00 6559 cpu[0] dnlc_purge_vp+0xa4
53 4% 39% 0.00 3583 cpu0 dnlc_purge_vp+0xa4
35 3% 42% 0.00 2684 cpu0 copyout_more+0x190
31 2% 44% 0.00 7042 cpu[0] dnlc_purge_vp+0xa8
24 2% 46% 0.00 6714 cpu[0] dnlc_purge_vp+0x148
19 1% 47% 0.00 3929 cpu0 dnlc_purge_vp+0xa8
15 1% 48% 0.00 5041 cpu[0] mutex_enter+0x8
13 1% 49% 0.00 3799 cpu0 mutex_enter+0x8
12 1% 50% 0.00 3449 cpu0 dnlc_purge_vp+0x148
10 1% 51% 0.00 2712 cpu[0] i_ddi_splx+0x1c
9 1% 51% 0.00 2320 cpu0 hwblkclr+0x94
8 1% 52% 0.00 7265 cpu[0] dnlc_purge_vp+0xa0
8 1% 52% 0.00 3183 cpu0 hwblkclr+0x9c
8 1% 53% 0.00 3397 cpu0 hwblkclr+0x98
7 1% 53% 0.00 2592 cpu0 copyout_more+0x194
5 0% 54% 0.00 2005 cpu0 segmap_getmapflt+0x124
4 0% 54% 0.00 3784 cpu[0]+11 disp_getwork+0x88
4 0% 54% 0.00 1441 cpu[0]+11 spl6+0x14
4 0% 55% 0.00 3253 cpu[0] spl6
4 0% 55% 0.00 5103 cpu[0] _resume_from_idle+0x1f8
4 0% 55% 0.00 2466 cpu0+0x6 pci_pbm_dma_sync+0x8c
4 0% 56% 0.00 2735 cpu0 hwblkclr+0xb0
4 0% 56% 0.00 2555 cpu0 dnlc_purge_vp+0xa0
4 0% 56% 0.00 2998 cpu0 page_lookup_create+0x90
3 0% 56% 0.00 2449 cpu[0]+11 disp_getwork+0x15c
3 0% 57% 0.00 3502 cpu[0]+11 disp_getwork+0xa4
3 0% 57% 0.00 3233 cpu[0]+11 i_ddi_splx
3 0% 57% 0.00 6187 cpu[0] r4find+0x14c
3 0% 57% 0.00 5585 cpu[0] copyout+0x25c
There's a strange function stealing almost 20% of the interrupts: dnlc_purge_vp
Solution
Knowing that the CPU is too slow for purging a large cache, we decided to decrease the cache from its default size to 25% of the default size. The ncsize kernel parameter is unfortunately not dynamic. We had to enter it in /etc/system and reboot the OS.
This was done on an indentical system with approx. the same load, and this is what lockstat reported after the reboot:
There's no dnlc_purge_vp function in the first 40% of the interrupts!
Running the dtrace script also confirms, that purge times have dropped linearly to about 25%:
# dtrace -s purge.d
dtrace: script 'purge.d' matched 2 probes
^C
latency
value ------------- Distribution ------------- count
256 | 0
512 |@ 1
1024 |@ 2
2048 |@@@@@@ 10
4096 |@@@@@@@@@@@@@@@@@@@@ 32
8192 |@@@@@@@@@@@@ 19
16384 | 0
Looking at the system over a day, the load and CPU utilization was much lower:


Conclusion
Solaris' dtrace tool is not just a marketing gag, but is real value for all production enviroments. We were able to find the bottleneck in no time (about 30 minutes of investigation + in this case reboot during off-peak hours).
Most importantly, we didn't have to risk production as dtrace is production safe.
Analysis
On our busiest days, we've seen the load go up to over 300. Luckily this is a SPARC system, and it was still somewhat responsive. Not bad for an old 2 Socket system...
Looking at the CPU utilization using vmstat, showed a high percentage of time spent in SYS.
You can see this in the two performance graphs (the graphs were made on a Sunday, with a lower load).


After looking at the processes with prstat -Lm (microstate accounting) and seeing the high SYS-percentage, we decided to look at what the kernel is doing.
Solaris has a nifty tool called lockstat. This is what it revealed:
# lockstat -i 133 -I sleep 5
Profiling interrupt: 1394 events in 5.241 seconds (266 events/sec)
Count indv cuml rcnt nsec CPU+PIL Caller
-------------------------------------------------------------------------------
214 15% 15% 0.00 1982 cpu0 (usermode)
174 12% 28% 0.00 3809 cpu[0] (usermode)
105 8% 35% 0.00 6559 cpu[0] dnlc_purge_vp+0xa4
53 4% 39% 0.00 3583 cpu0 dnlc_purge_vp+0xa4
35 3% 42% 0.00 2684 cpu0 copyout_more+0x190
31 2% 44% 0.00 7042 cpu[0] dnlc_purge_vp+0xa8
24 2% 46% 0.00 6714 cpu[0] dnlc_purge_vp+0x148
19 1% 47% 0.00 3929 cpu0 dnlc_purge_vp+0xa8
15 1% 48% 0.00 5041 cpu[0] mutex_enter+0x8
13 1% 49% 0.00 3799 cpu0 mutex_enter+0x8
12 1% 50% 0.00 3449 cpu0 dnlc_purge_vp+0x148
10 1% 51% 0.00 2712 cpu[0] i_ddi_splx+0x1c
9 1% 51% 0.00 2320 cpu0 hwblkclr+0x94
8 1% 52% 0.00 7265 cpu[0] dnlc_purge_vp+0xa0
8 1% 52% 0.00 3183 cpu0 hwblkclr+0x9c
8 1% 53% 0.00 3397 cpu0 hwblkclr+0x98
7 1% 53% 0.00 2592 cpu0 copyout_more+0x194
5 0% 54% 0.00 2005 cpu0 segmap_getmapflt+0x124
4 0% 54% 0.00 3784 cpu[0]+11 disp_getwork+0x88
4 0% 54% 0.00 1441 cpu[0]+11 spl6+0x14
4 0% 55% 0.00 3253 cpu[0] spl6
4 0% 55% 0.00 5103 cpu[0] _resume_from_idle+0x1f8
4 0% 55% 0.00 2466 cpu0+0x6 pci_pbm_dma_sync+0x8c
4 0% 56% 0.00 2735 cpu0 hwblkclr+0xb0
4 0% 56% 0.00 2555 cpu0 dnlc_purge_vp+0xa0
4 0% 56% 0.00 2998 cpu0 page_lookup_create+0x90
3 0% 56% 0.00 2449 cpu[0]+11 disp_getwork+0x15c
3 0% 57% 0.00 3502 cpu[0]+11 disp_getwork+0xa4
3 0% 57% 0.00 3233 cpu[0]+11 i_ddi_splx
3 0% 57% 0.00 6187 cpu[0] r4find+0x14c
3 0% 57% 0.00 5585 cpu[0] copyout+0x25c
There's a strange function stealing almost 20% of the interrupts: dnlc_purge_vp
The dnlc_purge_vp function belongs to the directory name lookup cache. It purges cache entries from time to time. You can read more about it here.
Next step was to find out how much time is spend in this function. A small dtrace script helped us:
purge.d:
fbt::dnlc_purge_vp:entry
{
        self->t = timestamp;
}

fbt::dnlc_purge_vp:return
/self->t/
{
        @["latency"] = quantize((timestamp-self->t)/1000);
        self->t = 0;
}
Running it, gives us a nice latency distribution table:
# dtrace -s purge.d
dtrace: script 'purge.d' matched 2 probes
^C
latency
value ------------- Distribution ------------- count
128 | 0
256 | 1
512 | 0
1024 | 2
2048 |@ 6
4096 |@ 10
8192 |@@@@@@ 65
16384 |@@@@@@@@@@@@@@@@@@@@@@ 247
32768 |@@@@@@@@@@ 112
65536 | 3
131072 | 5
262144 | 3
524288 | 0
dtrace: script 'purge.d' matched 2 probes
^C
latency
value ------------- Distribution ------------- count
128 | 0
256 | 1
512 | 0
1024 | 2
2048 |@ 6
4096 |@ 10
8192 |@@@@@@ 65
16384 |@@@@@@@@@@@@@@@@@@@@@@ 247
32768 |@@@@@@@@@@ 112
65536 | 3
131072 | 5
262144 | 3
524288 | 0
Looking at the result, we can see that most function calls take about 8-32ms. Really slow!
Solution
Knowing that the CPU is too slow for purging a large cache, we decided to decrease the cache from its default size to 25% of the default size. The ncsize kernel parameter is unfortunately not dynamic. We had to enter it in /etc/system and reboot the OS.
This was done on an indentical system with approx. the same load, and this is what lockstat reported after the reboot:
# lockstat -i 133 -I sleep 5
Profiling interrupt: 1344 events in 5.054 seconds (266 events/sec)
Count indv cuml rcnt nsec CPU+PIL Caller
-------------------------------------------------------------------------------
55 4% 4% 0.00 2301 cpu0 (usermode)
47 3% 8% 0.00 2510 cpu[0] (usermode)
42 3% 11% 0.00 1717 cpu[0] splx+0x1c
41 3% 14% 0.00 1667 cpu0 splx+0x1c
29 2% 16% 0.00 1718 cpu0 idle+0x12c
26 2% 18% 0.00 1758 cpu[0]+11 disp_getwork+0x98
22 2% 19% 0.00 1511 cpu[0] disp_getwork+0x174
20 1% 21% 0.00 1249 cpu[0]+11 disp_getwork+0x78
20 1% 22% 0.00 1406 cpu0+0xb disp_getwork+0x98
20 1% 24% 0.00 1627 cpu0+0xb disp_getwork+0x88
20 1% 25% 0.00 1498 cpu0+0xb i_ddi_splhigh+0x14
18 1% 27% 0.00 1324 cpu[0]+11 splx
18 1% 28% 0.00 1663 cpu0 disp_getwork+0x174
17 1% 29% 0.00 1592 cpu0+0xb disp_getwork+0x78
16 1% 31% 0.00 1284 cpu[0]+11 i_ddi_splhigh+0x14
16 1% 32% 0.00 1500 cpu[0] disp_getwork+0x1b4
16 1% 33% 0.00 1602 cpu[0] idle+0x12c
16 1% 34% 0.00 1438 cpu[0] i_ddi_splhigh+0xc
16 1% 35% 0.00 1696 cpu0+0xb splx
14 1% 36% 0.00 1571 cpu0 idle+0xf4
14 1% 37% 0.00 1411 cpu0 i_ddi_splhigh
13 1% 38% 0.00 1664 cpu[0] i_ddi_splhigh
12 1% 39% 0.00 1697 cpu[0] idle+0xec
...Profiling interrupt: 1344 events in 5.054 seconds (266 events/sec)
Count indv cuml rcnt nsec CPU+PIL Caller
-------------------------------------------------------------------------------
55 4% 4% 0.00 2301 cpu0 (usermode)
47 3% 8% 0.00 2510 cpu[0] (usermode)
42 3% 11% 0.00 1717 cpu[0] splx+0x1c
41 3% 14% 0.00 1667 cpu0 splx+0x1c
29 2% 16% 0.00 1718 cpu0 idle+0x12c
26 2% 18% 0.00 1758 cpu[0]+11 disp_getwork+0x98
22 2% 19% 0.00 1511 cpu[0] disp_getwork+0x174
20 1% 21% 0.00 1249 cpu[0]+11 disp_getwork+0x78
20 1% 22% 0.00 1406 cpu0+0xb disp_getwork+0x98
20 1% 24% 0.00 1627 cpu0+0xb disp_getwork+0x88
20 1% 25% 0.00 1498 cpu0+0xb i_ddi_splhigh+0x14
18 1% 27% 0.00 1324 cpu[0]+11 splx
18 1% 28% 0.00 1663 cpu0 disp_getwork+0x174
17 1% 29% 0.00 1592 cpu0+0xb disp_getwork+0x78
16 1% 31% 0.00 1284 cpu[0]+11 i_ddi_splhigh+0x14
16 1% 32% 0.00 1500 cpu[0] disp_getwork+0x1b4
16 1% 33% 0.00 1602 cpu[0] idle+0x12c
16 1% 34% 0.00 1438 cpu[0] i_ddi_splhigh+0xc
16 1% 35% 0.00 1696 cpu0+0xb splx
14 1% 36% 0.00 1571 cpu0 idle+0xf4
14 1% 37% 0.00 1411 cpu0 i_ddi_splhigh
13 1% 38% 0.00 1664 cpu[0] i_ddi_splhigh
12 1% 39% 0.00 1697 cpu[0] idle+0xec
There's no dnlc_purge_vp function in the first 40% of the interrupts!
Running the dtrace script also confirms, that purge times have dropped linearly to about 25%:
# dtrace -s purge.d
dtrace: script 'purge.d' matched 2 probes
^C
latency
value ------------- Distribution ------------- count
256 | 0
512 |@ 1
1024 |@ 2
2048 |@@@@@@ 10
4096 |@@@@@@@@@@@@@@@@@@@@ 32
8192 |@@@@@@@@@@@@ 19
16384 | 0
Looking at the system over a day, the load and CPU utilization was much lower:


Conclusion
Solaris' dtrace tool is not just a marketing gag, but is real value for all production enviroments. We were able to find the bottleneck in no time (about 30 minutes of investigation + in this case reboot during off-peak hours).
Most importantly, we didn't have to risk production as dtrace is production safe.

Comments