Posts

DTrace to the rescue!

Image
We recently migrated data to some older servers and ran into a performance problem during peakhours. Analysis On our busiest days, we've seen the load go up to over 300. Luckily this is a SPARC system, and it was still somewhat responsive. Not bad for an old 2 Socket system... Looking at the CPU utilization using vmstat, showed a high percentage of time spent in SYS. You can see this in the two performance graphs (the graphs were made on a Sunday, with a lower load). After looking at the processes with prstat -Lm (microstate accounting) and seeing the high SYS-percentage, we decided to look at what the kernel is doing. Solaris has a nifty tool called lockstat. This is what it revealed: # lockstat -i 133 -I sleep 5 Profiling interrupt: 1394 events in 5.241 seconds (266 events/sec) Count indv cuml rcnt     nsec CPU+PIL                Caller   ...
Package Deployment with OpsCenter

Image
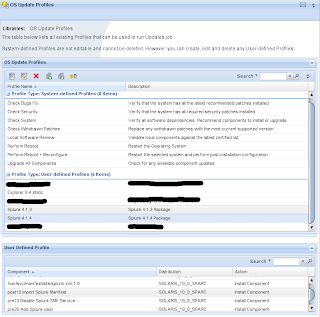
There has been some discussion on Constantins blog about working around IPS' scripting limitations. I don't want to talk about the reasons, why IPS does not have classical pre/postinstall-scripts, but I want to demonstrate how this functionality could be achieved with Oracle's Enterprise Manager OpsCenter. If you don't know OpsCenter, it's _the_ management tool from Oracle for Solaris, Unbreakable Linux and OracleVM. OS Updates In OpsCenter terminology Package deployments are called "OS Updates". OS Updates consist of Update Components (Packages, Patches and Configurations), Update Policies and Update Profiles. If an OS is to be updated, so called "Update Profile"-jobs will be sent to hosts run. Update Profiles There are two types of Update Profiles, System-defined and User-defined. What we're looking for are user defined profiles. A user-defined profile contains components. These components can be Packages, Pre/Postinstall-Scr...

Core Dump Analysis with mdb/dbx

We had a Java application core dump. pstack and jstack will show all threads, but does not reveal which thread's guilty. Finding this one thread is simple: # mdb /usr/bin/java /var/core/core_hostname_java_8081_8081_1276625241_1986 mdb: core file data for mapping at ffb80000 not saved: Bad address Loading modules: [ libumem.so.1 libc.so.1 libuutil.so.1 ld.so.1 ] > $C 4d2fe5f8 libc.so.1`_lwp_kill+8(6, 0, 20f04, ff36932c, ff38a000, ff38abdc) 4d2fe658 libumem.so.1`umem_do_abort+0x1c(3c, 4d2fe5a8, 6, 20e40, ff376ad8, 0) 4d2fe6b8 libumem.so.1`umem_err_recoverable+0x7c(ff377b54, a, 20d38, 656ebd84, ff38d0e8, ff377b5f) 4d2fe718 libumem.so.1`process_free+0x114(59c2008, 1, 0, 3e3a1000, 1ec08, 656d3e9c) 4d2fe778 libxy_xyzclient_native.so.solaris`XYZfree+0x1b8(59c2008, 65725b48, 15b, 4, 45a, 4d2fe9f8) 4d2fe810 libxy_xyzclient_native.so.solaris`XYZ_XYZ_FreeUser+0x28(59c2008, 4d2fea64, 4d2fe9e0, ffffff80, 80000000, 0) 4d2fe880 libxy_xyzclient_native.so.solaris`Java_net_xyz_xyzserve...

Read/Write Performance Observations

Image
As I mentioned in my previous post, we have now moved more active mailboxes to the Sun Oracle 7000 Storage System. Active means, incoming mails, POP3/IMAP4 accesses etc. Reads First we will take a look at disk read latency. We can see that more than 50% are lower than 10ms. A sanity check on one of the NFS-clients confirms this     r/s    w/s   kr/s   kw/s wait actv wsvc_t asvc_t  %w  %b device      73.6   36.5  494.4  317.7  0.0  0.3    0.1    2.4   1  22 filer:/filesystemb     39.8   31.7  322.2  445.4  0.0  0.1    0.4    1.8   1  12 filer:/filesystemb We can see that the average service time over this 10 second sample is around 2ms. Usually I'm not interpreting the %b value too much, other than if it constantly is at 100%. New...

ARC Cache revisited

Image
As we move more and more active mailboxes onto our OpenStorage box, it's time to have a look at the ARC cache. If you remember, I already blogged a while ago about the ARC. At that time we had only inactive mailboxes, with almost no access other than incoming mails. This is how it looks with active mailboxes: I've colored all the hits. As you can see, there is a huge amount of metadata hits and prefetched metadata hits. You can also see some data hits and prefetched data hits. We're now constantly adding more and more mailboxes to the system, resulting in more and more metadata. As the amount of data grows L2ARC will become more important. Stay tuned for a blog entry about how the L2ARC behaves...

Btrfs or how to lose space

On the linux-btrfs mailinglist there was an interesting entry about internal fragmentation in btrfs. A basic test brought up many questions about the btrfs filesystem design. Btrfs is a filesystem that uses the b-tree algorithm. There has been a debate if it is a good idea to use b-trees for filesystems. I'm not enough into algorithms, but I let you decide... The test consists of a loop, creating as much 2k sized files as possible on a 1GB Filesystem: # for i in $(seq 1000000); \ do dd if=/dev/zero of=/mnt/file_$i bs=2048 count=1; done (terminated after getting "No space left on device" reports). The result from Edward Shishkin (RedHat) was 59480 Files. This would give us 2048*59480 ~ 116MB. Or in other words, we would waste around 880MB of Space. In the meanwhile, Chris Mason, inventor of btrfs created a patch for increased utilisation. He was able to achieve 106894 Files. That's 208 MB or a waste of 800MB. I'm not sure what he meant by the comm...

Real-Time visualization of Spamhaus with Splunk

Static visualization is boring :-) This time I've run the same search in real-time...